A Sample E-CLASS Question
The E-CLASS survey asks students to express their attitudes about doing experimental physics. Most statements have three parts:
- What do YOU think when doing experiments for class? (a personal statement)
- What would experimental physicists say about their research? (a statement about how students perceive professional physics)
- How important for earning a good grade in this class was...? (a statement about how students perceive their laboratory course)
We ask "What do YOU think when doing experiments for class?" and "What would experimental physicists say about their research?" in both the pre-survey and post-survey, while the question about earning a good grade is asked only during the post-survey. By asking all three questions we can evaluate how personal views change during a course, how their view of a professional physicist changes, and how those changes correlate with what students thought was important for earning a good grade.
When doing a physics experiment, I don't think much about sources of systematic error.
| Strongly Disagree | 1 | 2 | 3 | 4 | 5 | Strongly Agree | ||||
| What do YOU think when doing experiments for class? | not answered | |||||||||
| What would experimental physicists say about their research? | not answered |
| Unimportant | 1 | 2 | 3 | 4 | 5 | Very Important | ||||
| How important for earning a good grade in this class was thinking about sources of systematic error? | not answered |
Identifying Valid Responses
In order for a student’s response to be considered valid and included in the analysis (e.g Table 1), it needs to pass several basic filters:
- The student must complete the survey (i.e., click through all the way to the end)
- The student must select a response for at least one question
- The student must respond correctly (i.e., ‘agree’ not ‘strongly agree’) to the filtering question used to eliminate responses from students who are not reading the questions.
- Only the first complete response for each student is included (i.e., duplicate responses from a single student are removed)
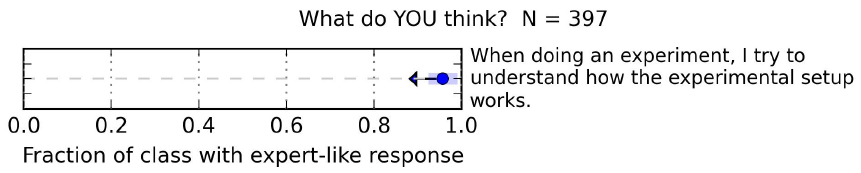
Representing Students' Pre/Post shifts
The arrow in Fig. 12 shows the shift between the pre- and post-survey. The shaded bar shows a 95% likelihood interval. Given the observed distribution of pre-responses, we would expect the expert-like fraction to lie within that band 95% of the time. The larger the arrow is compared to the shaded bar, the less likely the change could have occurred by chance.